


Ticker is the widget that presents the market data of a specific security on a horizontal bar. The display can be customised based on the client’s needs. For the issuer’s securities, the data shows information such as last price, percentage change and trend indication.
Investor Relations
It is the service that allows listed companies to communicate the performance of the company, its shares and bonds directly on their own website, to web users, media, investors and analysts.
Teleborsa's services cover a wide range of needs, offering customised solutions for each client. Thanks to the interactivity of the tools, users can access information simply and immediately, whether stock-market data or financial statement data. Teleborsa guarantees fast and intuitive access to the most relevant information.
Maximum configurability and flexibility, both in terms of technological architecture and delivery, are essential features of IR Solutions.

Ticker
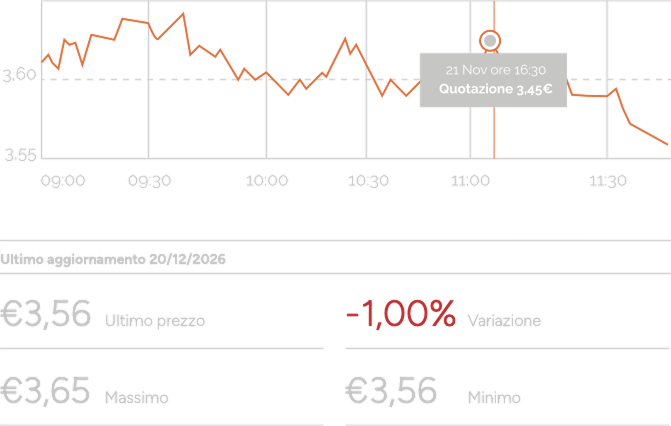
Share Price
It is the component that shows, both graphically and in figures, the performance of the company’s share over the selected period (intraday or historical).
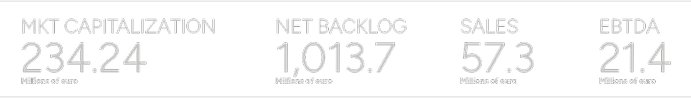
Mini KPIs and Company Highlights
This component shows the key strategic indicators useful for objectively quantifying the company’s performance through summary parameters, or for illustrating progress towards achieving set objectives.
The share on the stock market
The share on the stock market consists of a set of components to be placed in a common container, which can be driven by tabs or by a side-bar menu.
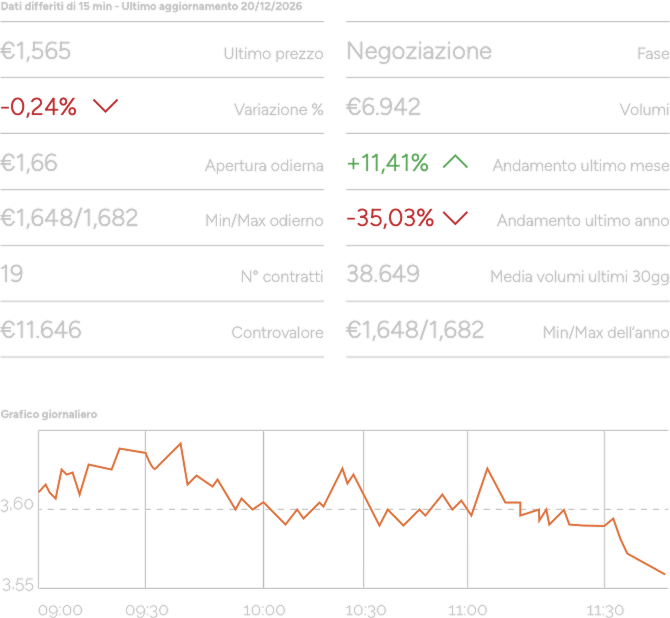
Security detail sheet
The detail sheet includes a wealth of information on the share, such as opening price, closing price, reference price, average price for the year, volumes, total value, number of contracts, etc.
Chart
The module, integrated as an iframe in the website pages, allows the main daily data to be displayed in real time or with a delay, together with the intraday or historical chart.
Interactive chart
The interactive chart makes it possible to observe the historical or intraday performance of the share, accompanied by technical analysis indicators such as multiple moving averages, RSI, ROC, Momentum, Bollinger Bands, Rate Of Change and CCI.
The chart can be displayed with or without volume and can be shown as a line, candlestick, bar or area chart. Events and news can be added to the chart.
Other features are available on request.
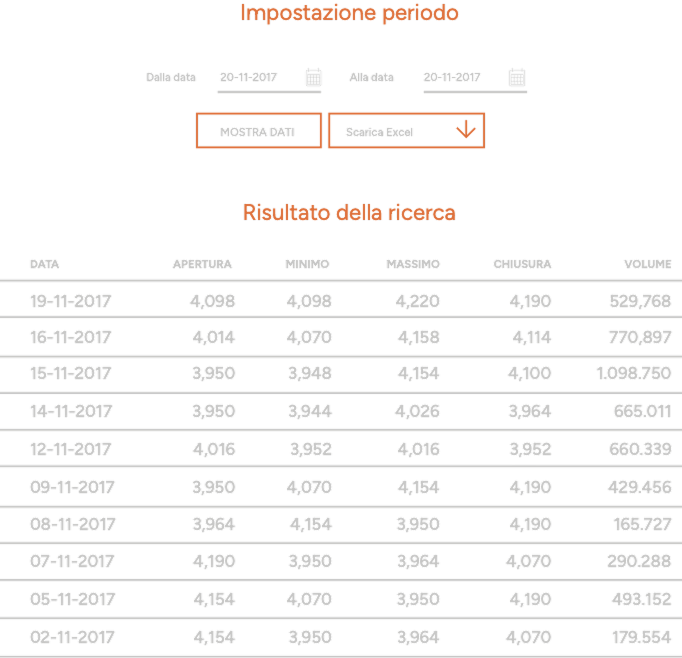
Historical prices
This module allows you to view or download the historical data of the Issuer’s security. Delivery draws on Teleborsa’s historical database, in which all data is adjusted according to the official stock-exchange coefficients.
The data includes end-of-day prices with opening, closing, low and high prices, as well as total volume and total value.
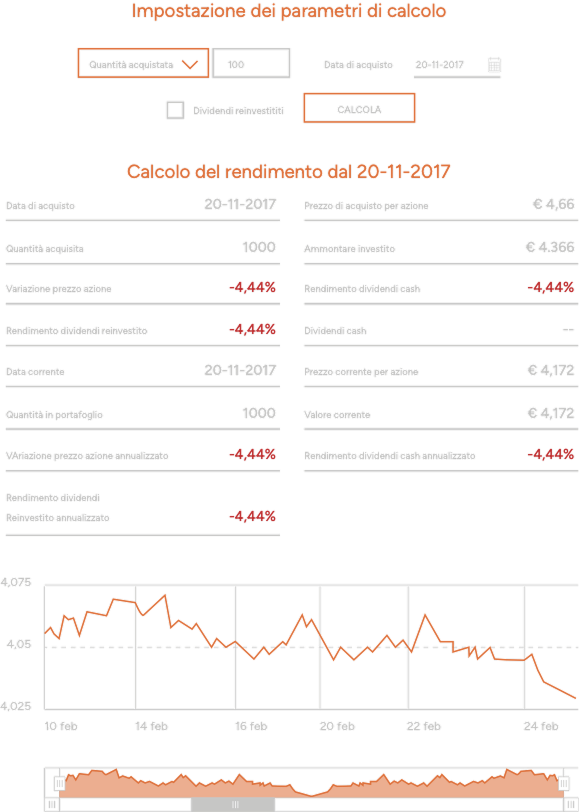
Investment calculator
The calculator module values the capital invested at the time of the purchase of the company’s securities and, using real-time updated prices, calculates the performance of the investment (return calculation), also providing the final value.
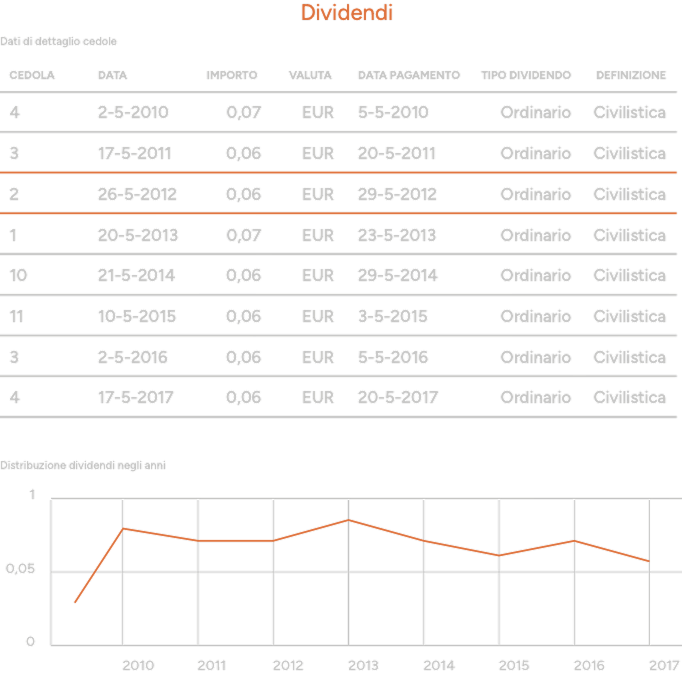
Dividends
The module allows the user to immediately view the company’s dividend distribution process, assess the capital remuneration policies adopted by the company, and understand the logic behind the dividend distribution, highlighting companies that generate wealth for their shareholders and regularly pay an ordinary dividend, or companies that have no investment plans and consequently adopt generous capital remuneration policies by paying extraordinary dividends, allowing the user to see at a glance whether the company being analysed is “value” or “growth”.
The detailed data table includes:
- announcement date;
- payment date;
- ex-dividend date;
- amount;
- currency;
- type of dividend;
- type of resolution;
- resolving body.
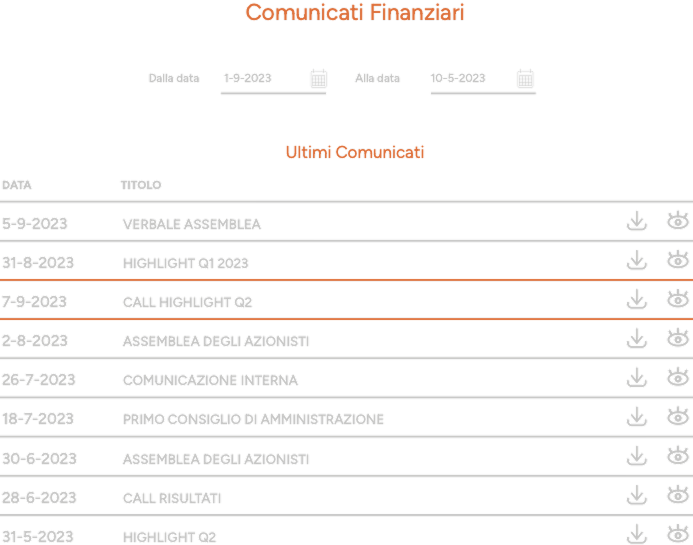
Price-Sensitive Announcements and Documents
This module manages the section relating to the presentation of the Regulated Information (Price-Sensitive Announcements) of the listed company. The Price-Sensitive Announcements are acquired without any intervention by the Investor Relator: once the company submits the Price-Sensitive Announcement to the Stock Exchange, it is automatically distributed to Teleborsa, which presents it in the section described above.
The announcements are presented in a panel, in chronological order (the most recent at the top), and are divided by year.
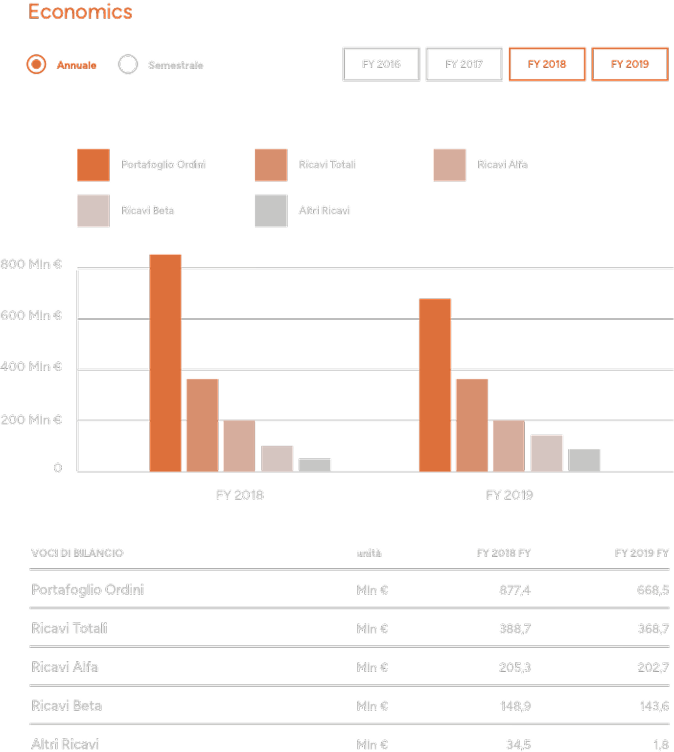
Interactive Data Mining
Interactive Data Mining is a powerful communication tool. It is a platform capable of presenting, in an interactive, graphic and animated way, the data that the company considers of interest to its investors and customers.
The information can be grouped, broken down and compared instantly and attractively. Users can define their own customised selection to print it or export it as a PDF document, an Excel spreadsheet or an image.
Interactive Data Mining is delivered as a series of presentations, in which the company indicates which items to publish.
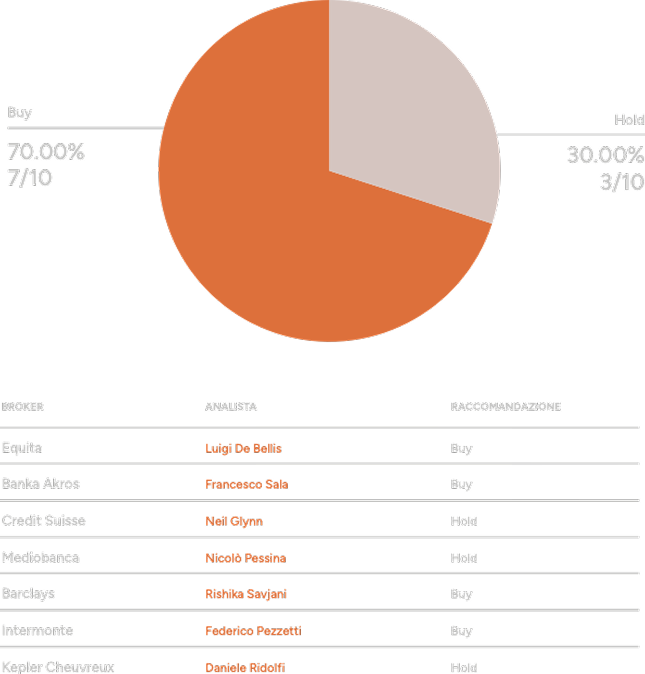
Analyst Coverage
The module allows you to view analyst coverage, highlighting the identity of each analyst, the broker, the recommendation and the analysis report, downloadable as a PDF.
The module can be accompanied by an interactive pie chart to graphically present the breakdown of recommendations (hold/buy, etc.).
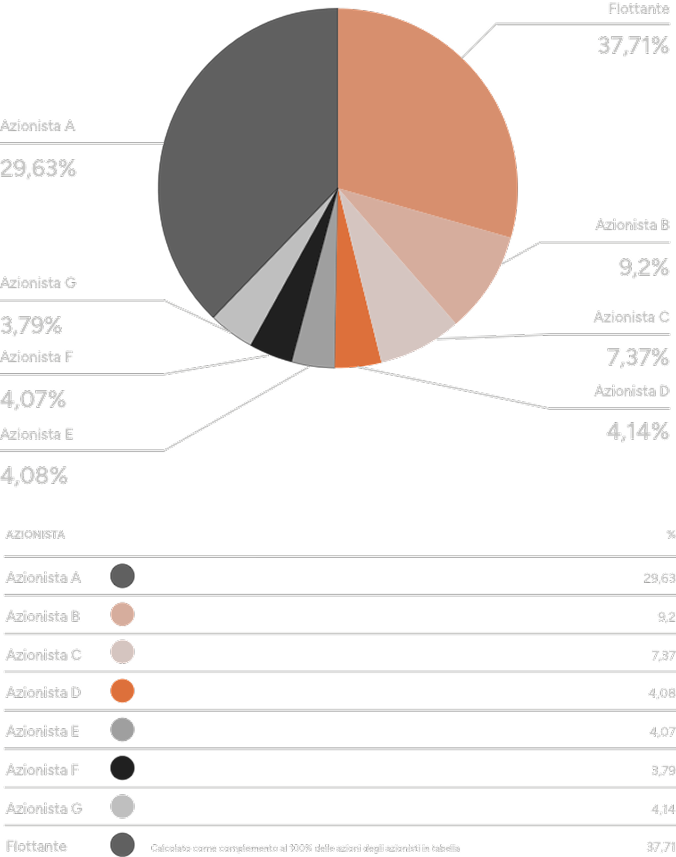
Shareholding
The module presents the shareholding broken down by main shareholders and by classes such as treasury shares and free float.